Quantcast
Channel: The Dygraphs Blog
Viewing all 29 articles
Browse latest View live

Hello, World!

$
0
0
What's the smallest HTML/Javascript snippet required to make a Dygraph? First, you need a div element to host your graph:

<div id="hello-world"></div>

And then you create the graph. A dygraph requires two parameters:
  • The document element created for the graph
  • A description of the data to be graphed
Additional options may be specified in a third parameter (though it's not required for the demo.)

There are several documented data formats; for this demo we're going to use multi-line text:

<script>
new Dygraph(
document.getElementById("hello-world"),
"Date,Hellos,Worlds\n" +
"2011/10/01,250,280\n" +
"2011/10/05,260,295\n" +
"2011/10/09,400,240\n" +
"2011/10/13,225,325");
</script>

Et voilà!

Dygraphs has an Annotated Range Selector!

$
0
0
Dygraphs now has an annotated range selector, thanks to an external contribution by Paul Felix. Inspired by Google's Annotated Time Line and other time series chart tools, you can now have easy zooming and panning of the data along the X axis. The widget is displayed at the bottom of the graph when you set the option showRangeSelector to true. Here is a simple example:

new Dygraph(
document.getElementById("graphdiv"),
data,
{showRangeSelector: true}
);
Some other notes:
  • Initially, the entire X range is shown.
  • Zooming is performed by dragging one of the two zoom handles.
  • Once zoomed in, panning is performed by dragging the section between the zoom handles.
  • A mini plot of the data is displayed in the range selector.
  • For multiple series, the mini plot is an average of the series values.
Additional range selector options are described in the Interactive Elements section of the dygraphs options reference.

Dygraphs and IE9

$
0
0
(This is a retread of a mailing list post from earlier this year Dan wrote, but it's so interesting I wanted to mildly edit it and repost it here. In fact, this very post was the motivation for finally starting this blog. -Rob)


This is a somewhat lengthy update on the current state-of-the-art when it comes to dygraphs and Internet Explorer. If you just want something to copy and paste to make dygraphs work in all versions of IE, here it is:

<!DOCTYPE html>
<html>
  <head>
    <meta http-equiv="X-UA-Compatible" content="IE=EmulateIE7; IE=EmulateIE9">
    <!--[if IE]>
    <script type="text/javascript" src="path/to/excanvas.js"></script>
    <![endif]-->

The 
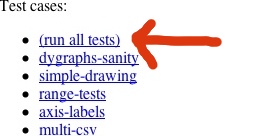
dygraphs home page and all tests now use this prologue. Here's the sequence that led to it:
  1. IE9's native <canvas> support is great.
  2. IE9 requires an HTML5 doctype to enable its native <canvas> support.
  3. An HTML5 doctype puts IE8 in standards mode, which breaks excanvas.
  4. excanvas can be fixed, but it requires a hack and doesn't work as well as in quirks mode.
  5. Using a very magical incantation, we can get the right combination of IE document modes.
  6. As a result of these, it might be time to try out FlashCanvas for dygraphs on IE8.
Longer story...On March 14, Microsoft released IE9. The focus of IE9 is on HTML5 support, including a native implementation of the <canvas> tag. This was an exciting development because it meant that, for the first time ever, dygraphs could run natively on the most-recent versions of all the major browsers.

Because many sites rely on quirks in older versions of IE, IE9 will, by default, render all pages in "Quirks mode". This is basically IE5.5 and it most certainly does not feature a native canvas tag.

To tell IE9 that you're quirk-free and would like all the new HTML5 features, you need to preface your page with an HTML5 doctype:

<!DOCTYPE html>
<html>
...
</html>

All of the dygraphs documentation and test pages use this doctype.

This doctype is also recognized by previous versions of Internet Explorer and puts them into Standards mode, rather than Quirks mode. Unfortunately, IE8 standards mode changed some of the behavior of VML, which is what excanvas used to emulate the <canvas> tag.

At this point, there are three different directions to go:
  1. Get IE to display in standards mode in IE9 but not in IE8.
  2. Fix excanvas.js to work in IE8 standards mode.
  3. Switch to a different <canvas> emulation system.
Let's look at each of these:

1. Get IE to display in standards mode in IE9 but not in IE8.

This would normally be done via a doctype, however, dygraphs is very much cutting against the grain by wanting IE9 standards mode but specifically wanting to avoid IE8 standards mode. There are a variety of sources of information about how to set the document mode from a web page, for instance:

Many of these resources are either incorrect, incomplete or outdated. I tried many different combinations of doctypes, conditional comments and <meta> tags before arriving at the magical incantation at the start of this email. I'm not entirely sure why it works, but it does seem to. It's fragile — if you reverse the order of the "IE=" clauses, it will break. MS typically goes to great lengths to avoid breaking existing behaviors, so if it works now, I believe that it will continue to work.

Just to be clear
- The <!DOCTYPE html> before the HTML suffices to get the native <canvas> tag in IE9.
- If you want to support IE8, you'll need the <meta> tag and the conditional excanvas include.
- If you only need to support IE7 and earlier, the <meta> tag is optional.

The snippet at the top of this email will always work, so you may as well just include it if you're going to support IE<9. The one quirk is that it will cause IE8 to render your page in IE7 standards mode. This isn't too big a deal, however, as relatively little changed between these two.

2. Fix excanvas.js to work in IE8 standards mode.

Microsoft changed quite a few things about VML in IE8, much to the consternation of VML users:
http://ajaxian.com/archives/the-vml-changes-in-ie-8

The update appears to have broken excanvas under some circumstances when used in IE8 standards mode. Dygraphs is one of these circumstances.

Reading around, I noticed this:
http://stackoverflow.com/questions/941170/does-anyone-could-make-excanvas-work-in-ie-8-with-jquery/1740754#1740754

As Ronald B. suggests, commenting out one line in excanvas.js un-breaks it in IE8 standards mode:
// el.style.overflow = 'hidden';  // fix IE8

However, as the blogger complains, VML in IE8 standards mode doesn't work as well as VML in IE7 standards mode or Quirks mode. You're better off dropping into IE7 mode.

3. Switch to a different <canvas> emulation system.

FlashCanvas (http://flashcanvas.net/) is a drop-in replacement for excanvas. Instead of relying on VML to work in older versions of IE, it uses Flash. This has a couple of consequences:
- it's faster
- it's less subject to the whims of IE
- flash and the DOM can get out of sync, leading to odd animations when panning.

It's also being actively maintained, unlike excanvas (which hasn't been updated in over a year). My copy of IE8 is a little bit janky, so it's hard for me to tell exactly how well it works. The dygraphs.com home page doesn't load for me when using it, for example. That's why I'd appreciate some feedback from the community about the relative merits of excanvas and FlashCanvas.

Dygraphs Coordinate Systems, 1/3

$
0
0
This is the first of three posts about the coordinate systems used throughout Dygraphs.
  • Part 1: Introduction and the Dygraph Data Coordinate System
  • Part 2: DOM Coordinate System
  • Part 3: Percentage Coordinate System
Introduction
This series of articles covers the three primary coordinate systems used in Dygraphs. They are: data coordinates, DOM coordinates, and percentage coordinates.

Each has its own distinct rules about origins and directions.

The entire series is based on this graph:


which is generated by this snippet of code:

new Dygraph(document.getElementById("graph"),
    [
      [1, [10,  10, 100]],
      [2, [15,  20, 110]],
      [3, [10,  30, 100]],
      [4, [15,  40, 110]],
      [5, [10, 120, 100]],
      [6, [15,  50, 110]],
      [7, [10,  70, 100]],
      [8, [15,  90, 110]],
      [9, [10,  50, 100]]
     ], {
       width: 500,
       height: 350,
       customBars: true,
       errorBars: true
     });

Dygraph Data coordinate system

The most obvious coordinate system to dygraphs is its inherent data coordinate system. The best way to demonstrate that coordinate system is through an example:

This highlighted point can be represented by the data coordinate system (4, 40). We’re even aided by the display on top showing the currently selected point.

Not to put too fine a point on it, but the x-value is 4, and the y-value is 40.

Graph data is always specified in the data coordinate system, and dygraphs does the job of translating those into points on the canvas. This should be no surprise to you, reading the code above shows the middle value for x=4 is 40.

This doesn’t always mean that the origin is in the lower-left corner of the graph area, since a graph can be resized and moved, but values almost always increase up and to the right.#

Before moving on to the next coordinate system, let’s play with the graph and its API. You can skip this section if you’re already comfortable with pulling values out of the graph.

Sidebar: Extremes and Visual Ranges

Extremes

Dygraphs provides a function that describes the extremes, or minimum and maximum data values, of the x-axis with xAxisExtremes:
g.xAxisExtremes()
[1, 9]

There is currently no yAxisExtremes function but Dygraphs an open source project; contributions are always welcome.

Visible Ranges

xAxisRange shows the visible data range along the x axis:
g.xAxisRange()
[1, 9]

Similarly yAxisRange shows the visible data range along the specified y axis:
g.yAxisRange()
[0, 131]

You’re wondering why the y axis range ends at 131 and not 120. This is because Dygraphs automatically adds a buffer to the top of most graphs’ y ranges for improved readability.
If you want the range to be precise, you can use the valueRange option with g.updateOptions({valueRange: [0, 120]}):

(Note there is currently a rendering bug where setting the value to 120 does something funny. This graph was rendered with a value range of 0-120.1.)

Remember these are visual ranges and not extremes of the data. So panning a graph along the x axis would result in a change in the x-axis range, but not x-axis extremes.

Dygraphs Coordinate Systems, 2/3

$
0
0
Update: 8:30AM Oct 4: to clarify several items.

This is the second of three posts about the coordinate systems used throughout Dygraphs.
  • Part 1: Introduction and the Dygraph Data Coordinate System
  • Part 2: DOM Coordinate System
  • Part 3: Percentage Coordinate System

DOM Coordinate System

Another coordinate system is the DOM coordinate system, which maps to coordinates of the underlying canvas.

(DOM coordinates are useful for mouse event handling. drawing on the underlay canvas, to name two things.)

DOM coordinates typically have (0,0) in the upper-left corner. While you might expect the corner to be in the drawing area, you’ll be surprised where that corner precisely is.


The Dygraph canvas coordinates don’t begin and end in what you would think of as the drawing area. No, in fact the canvas is widened to take up the space of the entire parent div element.

(People not familiar with Dygraphs may not realize, but the labels themselves are not canvas-drawn. They're part of the HTML DOM. As someone who had to understand these coordinate systems the DOM coordinate origin was a surprise. Other graphing systems draw their labels right on the canvas, e.g. http://code.google.com/apis/chart/, Dygraphs' does not.)

Note: A demo of a Dygraph without axis, using the full parent div element for its drawing area can be found at http://dygraphs.com/tests/unboxed-spark.html.

Clipping and other hackery

Here's an example that will help bring home home the difference between the full canvas area and the area exposed to the user, by way of a fun example, by showing how the image above was drawn:


g.updateOptions({
 underlayCallback: function(ctx) {
   ctx.canvas.width = ctx.canvas.width; // 1
   for (var y = 0; y <= 350; y += 50) {
     ctx.moveTo(0, y);
     ctx.lineTo(500, y);
     ctx.stroke();
   }
   for (var x = 0; x <= 500; x += 50) {
     ctx.moveTo(x, 0);
     ctx.lineTo(x, 350);
     ctx.stroke();
   }
}});


The line marked // 1, above is important. When the underlayCallback is called, it hands the caller a pre-initialized canvas context such that anything outside the graph area is clipped. (Having a clipping area is useful for graphing lines that exceed the boundaries of the clipped viewport.) A statement like // 1 reads like a no-op, but it has a side-effect of resetting canvas context, clearing the viewport, making that drawing possible. This is what the graph looks like without line // 1:

I hope you see now that (0, 0) doesn't represent the corner of the drawing area, but some spot which is fundamentally inaccessible to the user.

Note: Please don’t use this trick in graphs and applications you care about. This is only a hack for demonstrative purposes.

Conversion methods

The Dygraphs API comes with methods for converting between Data coordinates and Canvas coordinates

toDomXCoord converts from data X coordinates to DOM X coordinates


for (x = 1; x <= 9; x++) {
 console.log(x, '=>', g.toDomXCoord(x));
}
1 "=>56
2 "=>110.875
3 "=>165.75
4 "=>220.625
5 "=>275.5
6 "=>330.375
7 "=>385.25
8 "=>440.125
9 "=>495


toDomYCoord converts from data Y coordinats to DOM Y coordinates

for (y = 0; y <= 120; y+=20) {
 console.log(y, '=>', g.toDomYCoord(y));
}
0 "=>330
20 "=>279.618320610687
40 "=>229.23664122137407
60 "=>178.85496183206106
80 "=>128.4732824427481
100 "=>78.09160305343512
120 "=>27.709923664122137

and toDataXCoord and toDataYCoord convert X and Y values from the DOM coordinate system to the Data coordinate system.


g.toDataXCoord(56)
1
g.toDataYCoord(330)
0

Dygraphs Coordinate Systems, 3/3

$
0
0
This is the last of three posts about the coordinate systems used throughout Dygraphs.
  • Part 1: Introduction and the Dygraph Data Coordinate System
  • Part 2: DOM Coordinate System
  • Part 3: Percentage Coordinate System
Dygraph Percentage Coordinate System

Update: Yes, it's really the fraction of the drawable area (from zero to one) rather than a percentage (0 to 100.) If we rename the methods, I'll update this post.

There’s an additional coordinate system which represents percentages from the edges of the drawing area, relative to upper-left corner. These aren’t often required for public API, but can be useful when having to work strictly in the viewable area of the canvas. This is different than the DOM coordinate system which has its origin off the viewable area of the canvas. In this case, this coordinate system is all about the viewable area of the canvas.

These are accessible by the methods toPercentXCoord and toPercentYCoord.

toPercentXCoord takes a data X data value and converts it to a percentage from the left edge of the canvas. This diagram gives you an idea:
And to hit the point home, here’s a snippet of code which demonstrates values created by this function:

for (x = 1; x <= 9; x++) {
 console.log(x, '=>', g.toPercentXCoord(x));
}
1"=>"0
2"=>"0.125
3"=>"0.25
4"=>"0.375
5"=>"0.5
6"=>"0.625
7"=>"0.75
8"=>"0.875
9"=>"1


toPercentYCoord does the same thing along the Y axis, but goes from top to bottom.
The drawing area along the y-axis goes from 0-131, so let’s look at toPercentYCoord.

g.toPercentYCoord(0)
1


g.toPercentYCoord(131)
0


g.toPercentYCoord(120)
0.08396946564885496


g.toPercentYCoord(65.5)
0.5

Converting percentages back to data coordinates can be performed with this function:


function(pct) {
  var range = g.xAxisRange();
  return ((range[1] - range[0]) * pct) + range[0];
}

and a similar one for y-axis conversion. Validation is left up to the reader.

Summary

Each coordinate system has its own origin:
  • The Data coordinate system has its initial origin in the lower left corner, with increasing values moving up and to the right. This doesn’t mean the lower-right corner is (0,0), since the graph can be moved or resized.
  • The DOM coordinate system has its origin in the upper left corner of the unclipped canvas, with increasing values moving down and to the right. This is not the same corner as the percentage coordinate system. However, you are limited to drawing inside the graph area.
  • The percentage coordinate system has its origin in the upper left corner of the clipped canvas, with increasing values moving down and to the right.

API that can be used for translating between these coordinate systems are:
  • toDomXCoord and toDomYCoord convert data coordinate values to DOM coordinate values
  • toDataXCoord and toDataYCoord convert DOM coordinate values to data coordinate values
  • toPercentXCoord and toPercentYCoord convert data coordinate values to canvas percentages.

dygraphs 2011 year in review

$
0
0

It's been a big year for dygraphs!

Looking back at the last 365 days in the commit log, there were 356 commits. A big "thank you" to everyone who contributed:

  • danvk (207 commits)
  • kberg (107 commits)
  • nealie (13)
  • jeremybrewer (9)
  • antrob (8)
  • flooey (6)
  • paul felix (3)
  • bombela (1)
  • ben winslow (1)
  • Lee (1)

One thing I learned this year is how to better manage the commit history on the master branch. So those counts may understate the contributions of people like Paul who contributed later in the year.

So what changed? The flashy stuff first! Here were the new features:

It's also been a year of greatly-improved documentation. Some of the biggest wins here have been:

Finally, some of the biggest changes happened behind the scenes. kberg and I both learned a lot about JavaScript this year and used that knowledge to improve the dygraphs development process. The biggest changes in this category are:

auto_tests (kberg gets a dygraphs gold star for this one). Automated tests help us prevent unexpected side-effects from changes, as well as regressions. We had no automated tests at the start of the year, but now we have 83. This is good news for users as well as developers, who can make changes with a lot less fear than they did a year ago. Another gold star goes to Cory Smith for developing JSTD.

We also learned about the new "script mode" in ECMAScript 5, which tells the browser to complain when you use certain JavaScript features like global variables. All of dygraphs' JS files now run in strict mode and pass through jshint, a JavaScript linter. This will also help keep us from shooting ourselves in the foot.

There have been many other internal changes — we fixed a bajillion bugs, and antrob made some contributions which resulted in significant speedups for large charts.

So where is dygraphs going next? Here are some areas I'd like to work on next year:

  • Improved auto_test coverage
  • More intuitive/discoverable interactions
  • Nicer-looking charts
  • Better warnings when you misconfigure a Dygraph
  • Customized interactions for touch-screens
  • Speed improvements (maybe by using WebGL and reducing internal copying)
  • Improving dygraphs.com

All-in-all, 2011 has been a great year for dygraphs. Here's hoping that 2012 will be even better!

New Developer Feature: easier localized testing

$
0
0
If you're developing for Dygraphs, then you should know that we like tests. We've currently got 93 automated tests in the github repository (found at auto_tests/tests) and built an automated test suite thanks to JSTestDriver. We strongly encourage people to run the test suite when making Dygraphs changes (which is well documented in auto_tests/README.)

However, I've made interim testing much simpler. If you're not already familiar with auto_tests/misc/local.html, it's a hacked-down version of the automated test framework that you can easily run locally in any browser. This is particularly useful for debugging a broken test.

However, debugging those tests required a javascript console, and you had to know the name of the test you wanted to run. Now it's much simpler, as local.html will present you with a list of all test cases you can choose to run.


From there you can select an individual test case. Here, I've selected "to-dom-coords":


You can run one test, or all of them. Below you can see the results of running all the tests, with the output of the last test still on the document.

But if you want, you can run all the tests from all the cases!
And you'll get a long list of results to peruse at your pleasure.


Keep in mind that in-browser testing is not as thorough a test as running through JSTestDriver. This means that you still need to run the automated test suite when you can.

(Note: I know this works with Chrome, it might not work with your browser. Please let me know if it doesn't, or better, submit a patch!)

New Dygraphs Toy: the Palette

$
0
0
Happy New Year! I've been working on this for the last few days and am super excited it's finally ready to show. If you've wanted to learn how Dygraphs options work, then this will probably excite you too: the Dygraphs Options Palette, available at dygraphs.com/experimental/palette. It's easy, fun, and useful.

I've tested it with Chrome and Firefox/OSX. If you have a different browser, please give it a shot.

Major Features:
  • Make changes to a graph, live.
  • Support for most Dygraphs options (see below for details)
  • Live interaction with several predefined data sets.
  • Supports almost all Dygraphs data types, including string, int, float, boolean, string array, int array, boolean array, and function. (DOM element and dictionary are missing.)
  • Pretty integrated option help.
  • Designed with simple user experience in mind.
What's Left:
  • Not all options are supported. Some options, like labelsDiv and interactionModel are probably easy to support, but axis-specific options require more work.
  • While you can use one of the canned data sources, this palette should really work with user-supplied data sources.
  • Support for other browsers.
  • Exporting a set of options as a URL, or even a Javascript code snippet.
  • Graduate the palette into a full-featured library which can be easily applied to live graphs.

Stop reading, and go play with the options palette, available at dygraphs.com/experimental/palette. Feedback is welcome, and code is too.

Screen Captures


You can filter down the gigantic set of options and apply them appropriately.

In this example I've taken the basic graph and set the options drawPoints: true and pointSize: 5
And now I've changed the series colors using  colors: red, green, blue, black.

And can set all kinds of values, even callbacks.

And there's lots of tooltip help. Just hover over the lines.

Introducing the Dygraphs Gallery

$
0
0
I'd like to introduce you to the new Dygraphs Gallery, which can be found at http://dygraphs.com/gallery. We've taken some of the existing tests, cleaned them up a bit, and put them into a single easy-to-use web application.

In 2009, Dygraphs'tests directory was used mostly for verifying that the code hadn't broken, by examining each 'test' one at a time. The list of tests grew to over seventy strong. With the advent of the Dygraphs automated test framework, the tests directory was less a home for validating behavior (which, anyway, became rather unwieldy with so many of them) and more of a showcase of what's possible in small, discrete packages.

So rather than have a series of independent files, we modeled the gallery after the GWT Showcase, including showing the code required to make the demo.
The code behind each demo is there for your perusal.
With the new Gallery, the old-fashioned Dygraphs tests face a different future, either being turned into Gallery demos, automated tests, or deleted outright.

The Dygraphs Gallery is brand new, and we have more demos and features to add. If you have any thoughts on the matter, don't hesitate to let us know on the mailing list, or, as always, contributions are welcome.

Preventing Dygraphs Memory Leaks

$
0
0
As a matter of cosmic history, it has always been easier to destroy than to create." - Spock

Spock is the kind of guy who preferred C++ with its destructors (let alone multiple inheritance), and that quote clinches it.


But it's also pretty easy to destroy in Dygraphs, you just have to remember to do it. And if you don't remember, you might have to pay a penalty.

Have you used the Dygraphs benchmark? It's a great tool for validating that your browser can handle large loads of dygraphs data. For instance, here's a URL that generates 50,000 points of data, which it tends to render in about half a second:

http://dygraphs.com/tests/dygraph-many-points-benchmark.html?points=100&series=500

Actually, today we aren't going to talk about Spock, or speed, we're going to talk about memory leaks.

Thanks to an excellent post on using the Chrome Inspector to diagnose and find memory leaks, we can see. Read that post to see how to track memory consumption. For this test, I used the URL above, and clicked "Go!" five times in a row (as opposed to setting repetitions=5)


Notice how over time, memory seems to go up, and never down. A sure sign of a memory leak.
The post also covers the notion of heap snapshots and how to compare multiple snapshots. So as a follow-up I took a heap snapshot, clicked "Go!" once, took another snapshot, and compared them.


So, the number of graphs increased by two. That means the browser is holding on to two more instances of Dygraph, DygraphLayout, DygraphCanvasRenderer, you name it, with each new rendering. That could be the cause of our memory leak! (Remember that the benchmark shows two graphs, one which is benchmarked, and another one to show the values of each benchmark test.)

Let's see how the graphs are created in dygraph-many-points-benchmark:

  plot = new Dygraph(plotDiv, data, opts);

new Dygraph(
document.getElementById('metrics'),
durations,
{ ... });

The first one, upon deeper inspection, might be assigned to a local variable, but the variable is never used. In other words, with every iteration, that graph is just forgotten about.

That's about when Dan told me about Dygraph.destroy. According to the method's documentation:
Detach DOM elements in the dygraph and null out all data references. Calling this when you're done with a dygraph can dramatically reduce memory usage. See, e.g., the tests/perf.html example.
So I address that first case with the following change:

if (plot) { plot.destroy(); }
plot = new Dygraph(plotDiv, data, opts);


So now, before re-rendering the benchmark graph, the old graph is destroyed.

That second example, the one which stores durations of each benchmark, isn't even stored somewhere to be destroyed at a later time. However, rather than dispose that graph each time, I did something slightly different:

  var metrics = null;

if (!metrics) {
metrics = new Dygraph(
document.getElementById('metrics'),
durations,
{ ... });
} else {
metrics.updateOptions({file: durations});

Here, instead of destroying and recreating the graph, I just reuse it, pushing in new values using the file option.

The result?


Steady memory usage. You can see a temporary bump which occurred at a period where I clicked Go! a little too quickly but even that memory was reclaimed. If you zoom in on the image, you can see small hiccups in the memory use every time I regenerated the graphs.

The takeaways:
  • Don't assume your graphs are being destroyed when you no longer hold references to them.
  • Hold references to your graphs so you can destroy them with Dygraph.destroy.
  • Use updateOptions to replace graph data rather than constantly build new graphs.
  • Go read the post on diagnosing memory leaks in Chrome. Go.

Custom lines, a new feature

$
0
0
A guest post by Russell Valentine.

A new series option strokePattern has been added to Dygraphs. This option allows you to define the pattern Dygraphs draws for a particular series. No longer are we limited to solid lines. It takes an even length integer array as a argument. This allows you to come up with any pattern you like for your series. This could be helpful if you have many series plots on one graph and you can not or do not want to use color alone to differentiate them. See the dygraphs per-series test page, and below for an example:

g = new Dygraph(element, data, {
legend: ‘always’,
strokeWidth: 2,
colors: [‘#0000FF’],
‘sine wave’: {
strokePattern: [7, 2, 2, 2]
}
}
); 
The array defines the number of pixels that make up the drawn segments and space between them. It repeats the pattern throughout the line. The even indexes are drawn and the odd indexes are spaces. In pattern [7, 2, 2, 2] as shown in figure 2 below: seven pixels are drawn, there is a two pixel space, then two pixels are drawn then there is another two pixels space then it starts over again.

There are a few predefined patterns in Dygraphs. These are listed below, notice also when the pattern is null a solid line is used.


Dygraph.DOTTED_LINE[2, 2]
Dygraph.DASHED_LINE[7, 3]
Dygraph.DOT_DASH_LINE[7, 2, 2, 2]
nullnull


Dygraphs will use the strokePattern when creating the legend. If the pattern can not fit into the legend width, the pattern will be scaled to fit. This may give you unexpected results depending on the pattern you use. As an example, patterns [10, 5] and [20, 10] will look the same in the legend because they will be scaled to fit into the same width. You may need to either choose patterns that are clear in the legend or use your own legend.


The new option strokePattern is a powerful new feature for dygraphs. I hope you find it useful for your graphs.

New feature: custom points

$
0
0
I'm very excited about many of the new features coming to Dygraphs. Here's one that's available today: custom points via drawPointCallback and drawHighlightPointCallback.

Dygraphs already provides a two options, drawPoints and pointSize, which will draw a small circle at every data point. Dygraphs will also draw points when hovering near a data set, and that circles size is determined by the option highlightCircleSize.

But who wants to be stuck with circles?

The drawPointCallback and drawHighlightPointCallback options both accept a function which draws the shape you want right on the canvas. As a starting point, Dygraphs now supplies a set of basic images. You can see all of them below:

Dygraph.Circles.DEFAULT
Dygraph.Circles.TRIANGLE
Dygraph.Circles.SQUARE
Dygraph.Circles.DIAMOND
Dygraph.Circles.PENTAGON
Dygraph.Circles.HEXAGON
Dygraph.Circles.CIRCLE
Dygraph.Circles.STAR
Dygraph.Circles.PLUS
Dygraph.Circles.EX

The demo, which can be found here, also demonstrates drawing your own custom points, by drawing adorable little smiling and frowning faces.
More features are coming, so keep your eyes out for updates!

JavaScript and Dates, What a Mess!

$
0
0

We recently had a dygraphs regression where a date specified as "2012-03-13" would be displayed as "2012-03-12 20:00" when you hovered over it (or something else depending on your time zone).

The culprit wound up being surprising behavior from JavaScript's Date parser. Here's the gist of the problem, via the Chrome JavaScript Console:

> new Date("2012/03/13")
Tue Mar 13 2012 00:00:00 GMT-0400 (EDT)
> new Date("2012-03-13")
Mon Mar 12 2012 20:00:00 GMT-0400 (EDT)

So, why the discrepancy of four hours between these seemingly-identical dates? Here's another puzzler:

> new Date("2012-03-13")
Mon Mar 12 2012 20:00:00 GMT-0400 (EDT)
> new Date("2012-3-13")
Tue Mar 13 2012 00:00:00 GMT-0400 (EDT)

Why does that extra zero in the first form subtract four hours?

I've run into many issues with new Date and Date.parse while working on dygraphs over the years. This issue inspired me to put together…

The Comprehensive Cross-Browser
JavaScript Date Parsing Table

On that page, you'll see how a variety of browsers do (or don't) parse particular date strings.

Here are some rules of thumb:

  • Stick to "YYYY/MM/DD" for your date strings whenever possible. It's universally supported and unambiguous. With this format, all times are local.
  • Avoid using hyphenated dates ("YYYY-MM-DD") unless you know what you're doing. Only newer browsers support them.
  • So long as you specify four digits years, date strings at least have a unique parse across all browsers. Some browsers may return an error, but you won't get inconsistent behavior.
  • Chrome tends to be more accepting than other browsers. If a date format parses in Chrome, you shouldn't assume that it parses anywhere else.
  • If a recent browser can interpret as date string as ISO-8601, it will. With this format, your date/time string is interpreted as UTC.

With the table and these rules of thumb in hand, let's take another look at those mysterious Date parses from the beginning of the post:

> new Date("2012/03/13")
Tue Mar 13 2012 00:00:00 GMT-0400 (EDT)

This parses to midnight in the local time zone. This behavior is universal across browsers.

> new Date("2012-03-13")
Mon Mar 12 2012 20:00:00 GMT-0400 (EDT)

This can be interpreted as an ISO-8601 date, and so it is (following our last rule of thumb). This means that it is parsed as UTC. But it is displayed using local time. I'm in the EDT time zone, hence the difference of four hours. This format is only supported by newer browsers (Chrome, FF4+, IE9).

> new Date("2012-3-13")
Tue Mar 13 2012 00:00:00 GMT-0400 (EDT)

This cannot be interpreted as an ISO-8601 date, since it's missing a "0" in front of the month ("3" vs. "03"). So Chrome falls back to interpreting this as a local time. At the moment, Chrome is the only browser which supports this particular gem of a format.

A final cautionary note: if you are writing a library and wish to convert date strings to millis since epoch, the built-in Date.parse method looks like just the ticket. But you'll eventually run into an issue. For reasons known only to its authors, MooTools overrides this function with an incompatible version (theirs returns a Date, not a number). What you really want is new Date(dateString).getTime().

So if you're writing a library and you get a date string from your user, what should you do with it? In dygraphs, the answer keeps getting more and more complicated.

Swipe and pinch now work with Dygraphs!

$
0
0
Check it! Swipe and pinch now work with Dygraphs!


Dan, inspired by his new iPad 3, did some weekend hacking and made pinch and zoom work in Dygraphs. This also worked on my Samsung Galaxy Nexus, although the new Chrome browser is much more responsive than the default one.

You can see this for yourself at http://dygraphs.com/tests/demo.html

Testing from the Command Line with PhantomJS

$
0
0
I learned about the PhantomJS project recently and thought that it would be a good fit for dygraphs.

Our current testing setup involves several steps:
  1. Start a jstd server from the command line.
  2. Visit the server in the browser that you want to test.
  3. Run the jstd command with "--tests all" set.
  4. Tear everything down.
That's not too bad, but there is enough overhead that we don't run tests as frequently as we should. Case in point: I broke one of our tests nine days ago, but didn't realize it until this morning.

With phantomjs, this process is streamlined. You can do everything from the command line:

$ ./test.sh
Ran 118 tests in 1.397s.
118 test(s) passed
0 test(s) failed:
PASS


Phantom creates a headless web browser using WebKit. You drive the browser using JavaScript, and can execute commands in the context of any web page. I'm excited that it's working so well for dygraphs. No we'll have no excuses for not running auto_tests!

How to download and parse data for Dygraphs

$
0
0

One of the best things about Dygraphs is its simplicity under one of the most common circumstances - reading and rendering a CSV file from the web. And most people who use Dygraphs don't really care about data formats - they just want to graph their data. So users get unhappy when their CSV format doesn't quite fit their requirements. For example, here are some questions asked on our mailing listin the past week alone:
  1. Change the field separator in the CSV
  2. Hide columns from a CSV in the graph
  3. Split one CSV with four series into four separate graphs
  4. Combine two CSV files on one graph

If you know Dygraphs, you already know that 1, above, can most often be solved using the delimiter option (although in the user's specific case, it would not have helped, custom parsing was necessary.) And you also know that 2, above can be solved with the visibility option.

These aren't the only use cases. I recently wanted to add an additional synthetic column to my data by adding the value of two existing columns. But, as Dan recently said, Dygraphs is more about visualizing data than processing it.

Now, you might, if you've built an industrial app, just change your server code to convert your data into the format you require by adding a column, changing the delimiter, what have you. But sometimes you might not have control over the data coming from the server, or perhaps you're trying to build a one-off, and the most convenient place to make that change might be in the browser. So let's talk about what Dygraphs does when it receives a URL parameter, how it parses CSV data, and just how ridiculously easy it is for you to do it yourself.

Let's take the example of wanting to add a synthetic column: Let's say I have a CSV file called data.csv that looks like so:
Date,A,B
2012/01/01,10,10
2012/02/01,12,8
2012/03/01,13,9
2012/04/01,11,2
2012/05/01,13,5

Perfect, that's easy enough to render using the smallest bit of Javascript:

new Dygraph(div, 'data.csv');


Wow, that's simple.

In our case, we're want to add a synthetic column to data.csv that takes the sum of A and B. Unfortunately, this means we can no longer have code as simple as new Dygraph(div, 'data.csv');

We're going to do three things:
1. Download the file
2. Parse its contents
3. Add the column

Downloading the file

When you specify a URL (or filename) in the Dygraph constructor, it fetches the content for you using XMLHttp, the backbone of Web 2.0. Here's the snippet required to fetch the content:
var req = new XMLHttpRequest();
req.onreadystatechange = function () {
if (req.readyState == 4) {
if (req.status === 200 || // Normal http
req.status === 0) { // Chrome w/ --allow-file-access-from-files
var data = req.responseText;
drawGraph(data);
}
}
};
req.open('GET', 'http://localhost:8000/data.csv', true);
req.send(null);
var drawGraph = function(data) {
console.log(typeof(data));
console.log(data);
new Dygraph(div, data);
}

I added the console.log at the end just to demonstrate that the data is a String representation of the file.


I'm not going to go into detail about the XMLHttpRequest API - that's for experts in that domain to handle, and also, this document covers it. Suffice it to say that the callback is required since the XMLHTTPRequest is asynchronous. You can also read the private function start_ in dygraph.js.

Parsing the contents

So that first part wasn't so bad. Parsing the contents is going to be similarly easy. We're going to turn the CSV into an array. Go read the section in the Dygraphs Data Format document on arrays, and pay close attention to this piece of text:
If you want your x-values to be dates, you'll need to use specify a Date object in the first column. Otherwise, specify a number. Here's a sample array with dates on the x-axis:
So since in this case, the first column is a date, we'll have to turn it the values in the first column into Date objects, and turn our subsequent values into numbers.
var toArray = function(data) {
var lines = data.split("\n");
var arry = [];
for (var idx = 0; idx < lines.length; idx++) {
var line = lines[idx];
// Oftentimes there's a blank line at the end. Ignore it.
if (line.length == 0) {
continue;
}
var row = line.split(",");
// Special processing for every row except the header.
if (idx > 0) {
row[0] = new Date(row[0]); // Turn the string date into a Date.
for (var rowIdx = 1; rowIdx < row.length; rowIdx++) {
// Turn "123" into 123.
row[rowIdx] = parseFloat(row[rowIdx]);
}
}
arry.push(row);
}
return arry;
}
You'll also need to split out the header row as the labels option.
var drawGraph = function(data) {
var arry = toArray(data);
var firstRow = arry[0];
var data = arry.slice(1); // Remove first element (labels)
new Dygraph(div,data, { labels: firstRow });
}
This code sample doesn't address all cases for parsing. For instance, it expects the first column to be a date string. If you want to know more about how Dygraphs parses CSV, read the parseCSV_ function in dygraph.js.

Adding the column

Now we have an array, it should be dead simple to add the additional column. Here's what we know:
  1. The first row contains the headers, so we'll need to add an additional element to the header array.
  2. Each subsequent row in the array contains data, and those values will be in the row's second and third elements (indexes 1 and 2.)
And here it is. Pretty straightforward:
var drawGraph = function(data) {
var arry = toArray(data);
var firstRow = arry[0];
var data = arry.slice(1);
firstRow.push("sum");
for (var idx = 0; idx < data.length; idx++) {
var row = data[idx];
var sum = row[1] + row[2];
row.push(sum);
}
new Dygraph(div,data, { labels: firstRow });
}

Addenda

  • Oftentimes, people ask about the ability bypass the browser cache when fetching data to ensure the graph is always up to date. Since it's of related interested, I've included a reference to bypassing the cache here.
  • Javascript libraries simplify the work around XMLHttp, so instead of having to write all the code above, you might want to invest some time in using jQuery (with its ajax function) or the Closure library.
  • Don't forget that the URL you request for data needs to be on the same domain as the page requesting it, otherwise your XHR will be rejected.
  • Javscript's parseFloat is not precisely the same as Dygraphs' own parseFloat_ method. Read the code for details.

Canvas Adoption in Major Browsers

$
0
0

(if you're reading this in an RSS reader, come to the blog to see some nice charts!)

dygraphs is based around the <canvas> tag, which first appeared in Safari in 2004. It was quickly adopted by other browsers, with one notable exception.

When I initially wrote dygraphs in 2006, Internet Explorer market share was 80–90%. When I released it in late 2009, <canvas> was still supported in less than 50% of browsers. Recently, however, that has been changing dramatically:

With over 80% of browsers supporting it, the conventional wisdom that <canvas> is not "safe" to use needs some rethinking!

There are two drivers of this phenomenon.

The first is Google Chrome. Since its debut in 2008, Chrome has achieved over 30% market share. Over the same time span, Firefox has gone from 26% to 25%. Nearly all of Chrome's gains, in other words, have been coming from IE:

The other driver was the introduction of IE9, the first version of Internet Explorer to support <canvas>:

Firefox and Chrome have been increasing <canvas> support for years by eating away at IE's market share. IE9 has accelerated the trend by making Internet Explorer a better browser.

What does this all add up to? It means that hacks like excanvas won't be necessary for much longer, as more and more web users get a first class dygraphs experience.

Data source: statcounter


Introducing Custom Plotters

$
0
0

Once you get your chart displaying with dygraphs, you'll want to customize its appearance.

dygraphs includes a plethora of options for doing simple customization, e.g. colors, strokeWidth, drawPoints, stackedGraph and fillGraph. You can see examples of all of these in use from the links off the options reference, or you can play around with them yourself using the experimental palette.

But what if you want to do something really crazy? To fundamentally change the way that data series are displayed? We've recently added a new plotter option which lets you customize to your heart's content.

The standard plotter just draws lines from point to point. While it's a bit more complex in reality, in essence, it's just this:

g = new Dygraph(div, data, {
plotter: function(e) {
var ctx = e.drawingContext;
ctx.beginPath();
ctx.moveTo(e.points[0].canvasx, e.points[0].canvasy);
for (var i = 1; i < e.points.length; i++) {
var p = e.points[i];
ctx.lineTo(p.canvasx, p.canvasy);
}
ctx.stroke();
}
});
(View/Edit in jsFiddle)

The plotter is called once for each series that needs to be drawn. Its one parameter is a dictionary of useful data about the series and the dygraph. The essential properties are the ones which we use here, namely:

  • drawingContext: a <canvas> drawing context on which you should render this series.
  • points: an array containing the individual points to draw. Each entry has a canvasx and canvasy attribute which tells you where to draw the point.

dygraphs will set up the drawing context for you as best it can. There's no need for you to set the stoke width or color for each series unless you want to do something unusual.

Other properties passed to the plotter include:

  • setName: the name of the series being drawn, e.g. "Y2"
  • color: the color of the series being drawn (you won't normally need this, see above)
  • strokeWidth: the width of the line being drawn (again, you won't normally need this, see above)
  • dygraph: A reference to current dygraph object (useful for calling getOption() and friends)
  • plotArea: Contains x, y, w and h properties which define the plotting rectangle.

As a simple example of what a custom plotter can do, let's make dygraphs draw bar charts instead of line charts.

Here's a bar chart plotter:

function barChartPlotter(e) {
var ctx = e.drawingContext;
var points = e.points;
var y_bottom = e.dygraph.toDomYCoord(0); // see http://dygraphs.com/jsdoc/symbols/Dygraph.html#toDomYCoord

// This should really be based on the minimum gap
var bar_width = 2/3 * (points[1].canvasx - points[0].canvasx);
ctx.fillStyle = e.color;

// Do the actual plotting.
for (var i = 0; i < points.length; i++) {
var p = points[i];
var center_x = p.canvasx; // center of the bar

ctx.fillRect(center_x - bar_width / 2, p.canvasy,
bar_width, y_bottom - p.canvasy);
ctx.strokeRect(center_x - bar_width / 2, p.canvasy,
bar_width, y_bottom - p.canvasy);
}
}

And a dygraph that uses it:

g = new Dygraph(div, data, {
plotter: barChartPlotter,
dateWindow: [0, 9] // avoid clipping first and last bars
});

and here's what the output looks like:

(View/Edit in jsFiddle)

Pretty easy! And since this is dygraphs, you get nice things like (animated) zooming, panning and hover labels for free. Try it out by clicking and dragging to zoom, or holding down shift and dragging to pan.

You can mix and match different plotters by setting the plotter option on a per-series basis. Here's how you might combine a line and bar chart (aka a Pareto chart):

g = new Dygraph(div, data, {
"Late Arrivals": {
plotter: barChartPlotter
},
});
(View/Edit in jsFiddle)

This is admittedly a bit simplified: a real Pareto chart would list causes on the x-axis (instead of numbers) and would use two y-axes. In a future post, we'll try to recreate this Wikipedia Pareto chart more precisely using a valueFormatter and a secondary y-axis.

In the mean time, check out the plotters demo for some examples of how to use this exciting new tool.

HTML5 Charting Tool Performance Comparison

$
0
0

Akram El Assas has written up a performance comparison of dygraphs and a few other HTML5 charting libraries over at CodeProject.

dygraphs has always been written with large data sets in mind, and so it does quite well on these benchmarks. The one million point benchmark is particularly good:

dygraphs was the only library to complete the 1M point benchmark on 3/5 browsers, and was 6x faster than the competition on one of the others. There are a few tricks that we use to keep dygraphs running fast on large data sets. These are mostly under-the-hood, but they'll be great fodder for a future blog post.


Viewing all 29 articles
Browse latest View live